Sound Levels
Sound Pressure Levels
Our ears respond to fluctuations in the steady atmospheric pressure, so when measuring sound, that is what we usually measure. Sound pressure levels (or Sound Levels for short) are specified in Decibels, relative to a reference pressure of 20 micropascals.
This reference pressure of 20 micropascals is nominally equal to the threshold of hearing (the quietest sound that can be detected) for a healthy young person, at one kilohertz. 0 dB SPL thus represents an extremely low sound level, that is unlikely to be met in practice. It is well below the lowest level that can be measured by an ordinary sound level meter so it is very rare (though not impossible) to come across sound levels expressed as a negative number of decibels SPL.
Strictly speaking the reference pressure should always be specified. However, 20 micropascals is invariably the reference for sound in air, so it is often omitted except in formal scientific work.
Sound pressure is almost always measured as RMS. The only common exception is the measurement of peak level from gunshots, etc., to assess the likelihood of instant hearing damage. In that case, both positive and negative variations are measured using a fast peak detector.
Weighted Levels – the dBA etc.
Within the range of “normal” hearing (often taken for convenience as 20 Hz to 20 kHz) the ear does not respond equally to sounds of different frequencies.
At low sound levels, for a sound at 50 Hz to be percieved as equally loud as a 1 kHz sound, the lower frequency would have to be about 30 dB higher in level. However for very loud sounds, the ear is relatively much more sensitive at low frequencies, and the difference reduces to about 10 dB.
The maximum sensitivity of the ear occurs at about 3.5 kHz, corresponding to the resonance frequency of the air in a typical human ear canal.
To make sound level meter readings correspond with what we hear, we must reduce the response to low frequency sounds, also to some extent to very high frequency sounds, and increase the sensitivity to sounds in the 3 kHz region. This is called “frequency weighting”. In theory, the weighting would have to vary according to the sound level, but in practice, it is found that a single filter makes the meter reading agree quite well with the perceived loudness over a wide range of sound levels. Various filter curves are used and have standardised curves – the most common one met in the audio industry is termed the A weighting curve. Sound meter measurements made without a weighting curve are shown in dB (SPL); measurements with an A weighting curve are shown as dB A (the AES and IEC disapprove of this notation, preferring dB A-weighted or dB A-wtd. If a weighting curve is used it must be indicated since the figures obtained will often vary widely from those without.
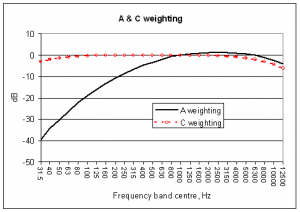
The B-weighting curve is not normally met but a C-weighting exists which is largely flat but with a filter that has a gentle roll-off at the extremes of the audible range. The graph below shows both A and C weighting curves.
Sound level meters also include a “linear” setting to include the whole audio frequency range without filtering. But the “linear” frequency response is not standardised, and modern meters instead have Z-weighting for this purpose. In practice, the frequency response of a sound level meter will be controlled by the performance of its microphone. Special microphones must be used for accurate measurement at the top end of the audio range and above, and also for infra-sound.
Meter Time Constants
For fast varying sounds, a sound level meter reading will depend on the time constant of the RMS detector. There are two standard time constants, one-eighth of a second and one second, called F and S (fast and slow) respectively. A third option, I (impulse) is designed to catch transients: it has a fast attack and slow decay rather like a PPM. I (impulse) is not used much now.
Leq
When measuring using the F or S time constants, the reading will usually fluctuate, and must be estimated using an “eyeball average”, so different operators could get different results. Good quality meters can integrate the sound level over a specified period, to give a single definite answer. The level measured in this way is called Leq. It can be described as an energy average: it is the level of the continuous steady sound that would have the same energy as the varying sound that has been measured.
Octave and 1/3 Octave Band Measurements
It is often useful to know the frequency content of the sound. Some meters can analyse sound into octave or 1/3 octave bands. As only part of the sound is being measured in each band, sound levels will be lower in the individual bands than in the wideband measurement, unless the whole sound is contained within one band. In the same way, sound levels will appear lower when measured in 1/3 octave bands than in octave bands.
Noise Rating Methods
Background noise in buildings (including in radio and TV studios), for example from ventilation systems, can be specified using A-weighted decibels, but it is more usually specified using an octave band rating system. The two most common systems are NR (Noise Rating) and NC (Noise Criterion).
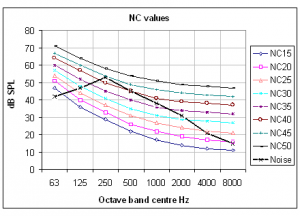
The figure below shows noise plotted in octave band levels on a graph, which also has curves from the NC system. In this example, the lowest curve that the noise does not exceed in any frequency band is the NC45 curve, and it is therefore rated at NC45. Acceptable levels for studios generally range from NC15 to NC30, depending on the purpose. The BBC has its own background noise criteria, which are based on 1/3 octave measurements.


